3 Business Intelligence Problems We Built Loop to Resolve
 Simon Porri
·
5 minute read
Big data is crucial for the modern economy. Businesses worldwide rely on data daily to understand the needs of customers and improve operations. But not every company succeeds in identifying the growth opportunities hidden amidst large pools of data. You need to be able to harness and analyse information the right way so you can take informed actions — rather than end up drowning in a sea of de-contextualised data points.
Traditional business intelligence tools are designed to simplify data analysis. But, too often, they still leave users struggling to connect the dots between analysis and action. Central to why we built Loop is the delivery of actionable insights that can make the practical application of data analysis simpler, and more effective at driving commercial outcomes. This article is going to look at three main problems that make it difficult to use business intelligence tools, and how Loop delivers a better solution. Let’s get started.
Problem 1: Overly complex and technical reporting
Traditional business intelligence can be technically focused, making it complex to access and use. Oftentimes, only IT staff or data analysts can navigate the large volumes of data stored in data warehouses and use complex BI tools to extract the insights requested by other teams. However, competing priorities easily result in delayed or insufficient reporting. Fundamentally, traditional business intelligence is far too often inaccessible to the people who need those insights — completely undermining the value of the resources available.
How Loop creates a solution
Loop solves this business intelligence problem by providing easy access to data directly to the business users that need it — removing the need for technical staff to be involved. For self-service BI to work, Loop is designed to be practical and user-friendly. It’s an intuitive BI tool that anybody can use, especially non-technical business users.
Specifically, Loop delivers hierarchical reporting by surfacing data at different levels, accommodating a business with multiple hierarchy levels. That way, every team accesses the data it needs. Loop also comes with a set of features that make reporting fast and easy. These include:
- Balanced scorecards: Widely used as a reporting framework, balanced scorecards let you measure operational and experiential performance to uncover inefficiencies and opportunities for improvement.
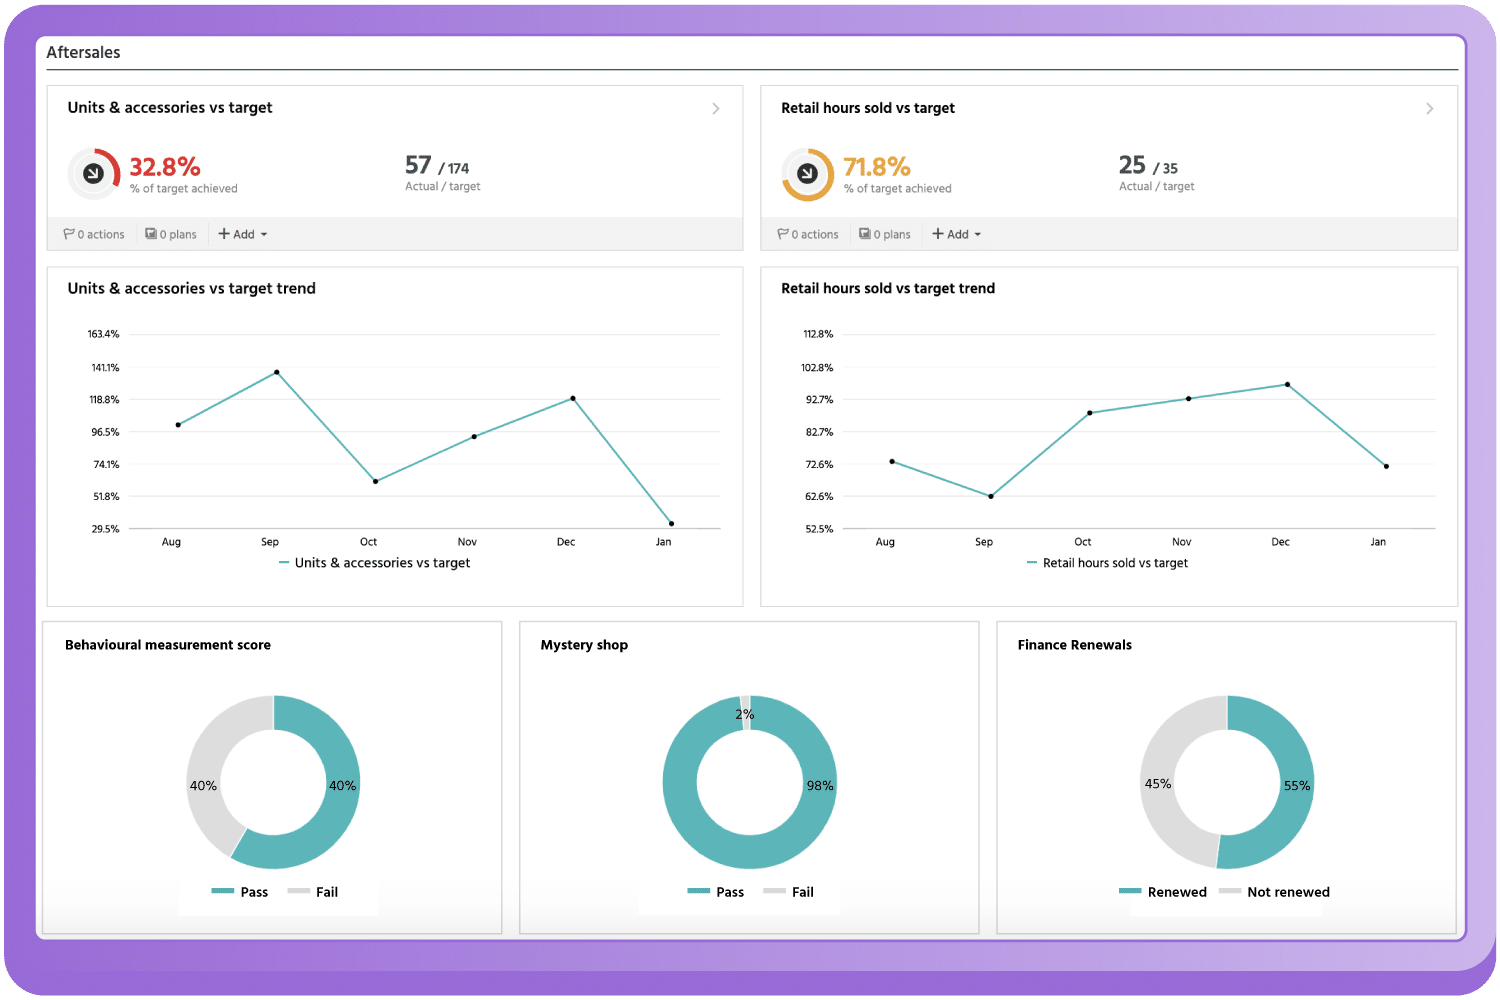
- Dashboards: Loop analyses real-time data to display all the KPIs you need to track, making reporting a breeze. We can configure custom dashboards so that each business function can glean insights from the data that’s relevant to it.
- Usage reporting: Easily monitor how Loop is used across your business with the reporting module. It shows you the activity levels within each module and the platform as a whole.
Loop makes interpreting data easy which saves users a great deal of time and focuses them on taking actions — which leads us onto the next BI challenge.
Problem 2: Analysis that is detached from actions and outcomes
Data collection and analysis are often done without the specific circumstances of the organisation in mind. This lack of data contextualisation keeps managers stuck in the analysis stage when they should extract insights that inform action taking, ultimately creating profitable outcomes.
The value of this approach is easier to think about if you breakdown “information” into three different categories:
- Data: The component pieces of information.
- Analysis: The sorting of data into meaningful groups — enabling interpretation of that information.
- Insights: Analysis that has been contextualised with additional information, allowing you to take action based on that analysis.
Without contextualising your analysis and data, you cannot inform effective strategic thinking or decision-making — for example, identifying strategies to improve business efficiency. It remains unclear which KPIs you should track, how to set KPIs, or what actions are actually able to drive outcomes. Many business intelligence tools stop at analysis. Loop makes sure to go that one step further.
How Loop creates a solution
Loop doesn’t just visualise business intelligence — it invites the user to take actions based on intelligence, and then is able to track the progress of said actions. You can even benchmark how actions are impacting outcomes, and use that information to improve business performance even further.
Loop delivers this insights-driven and action-orientated strategy with three specific features:
1. Dashboards
The same intuitive dashboards that make non-technical access to Loop possible also focus users on actionable insights, KPIs and business performance stats that are important to that user. You can then drill down into a given KPI to reveal more in-depth information. You can also compare different KPIs over a specific period to identify trends and correlations — something traditional BI solutions struggle to deliver. The outcome is a simple way to focus on the right high-level information, and then deep-dive into specifics where necessary.

2. Action planning
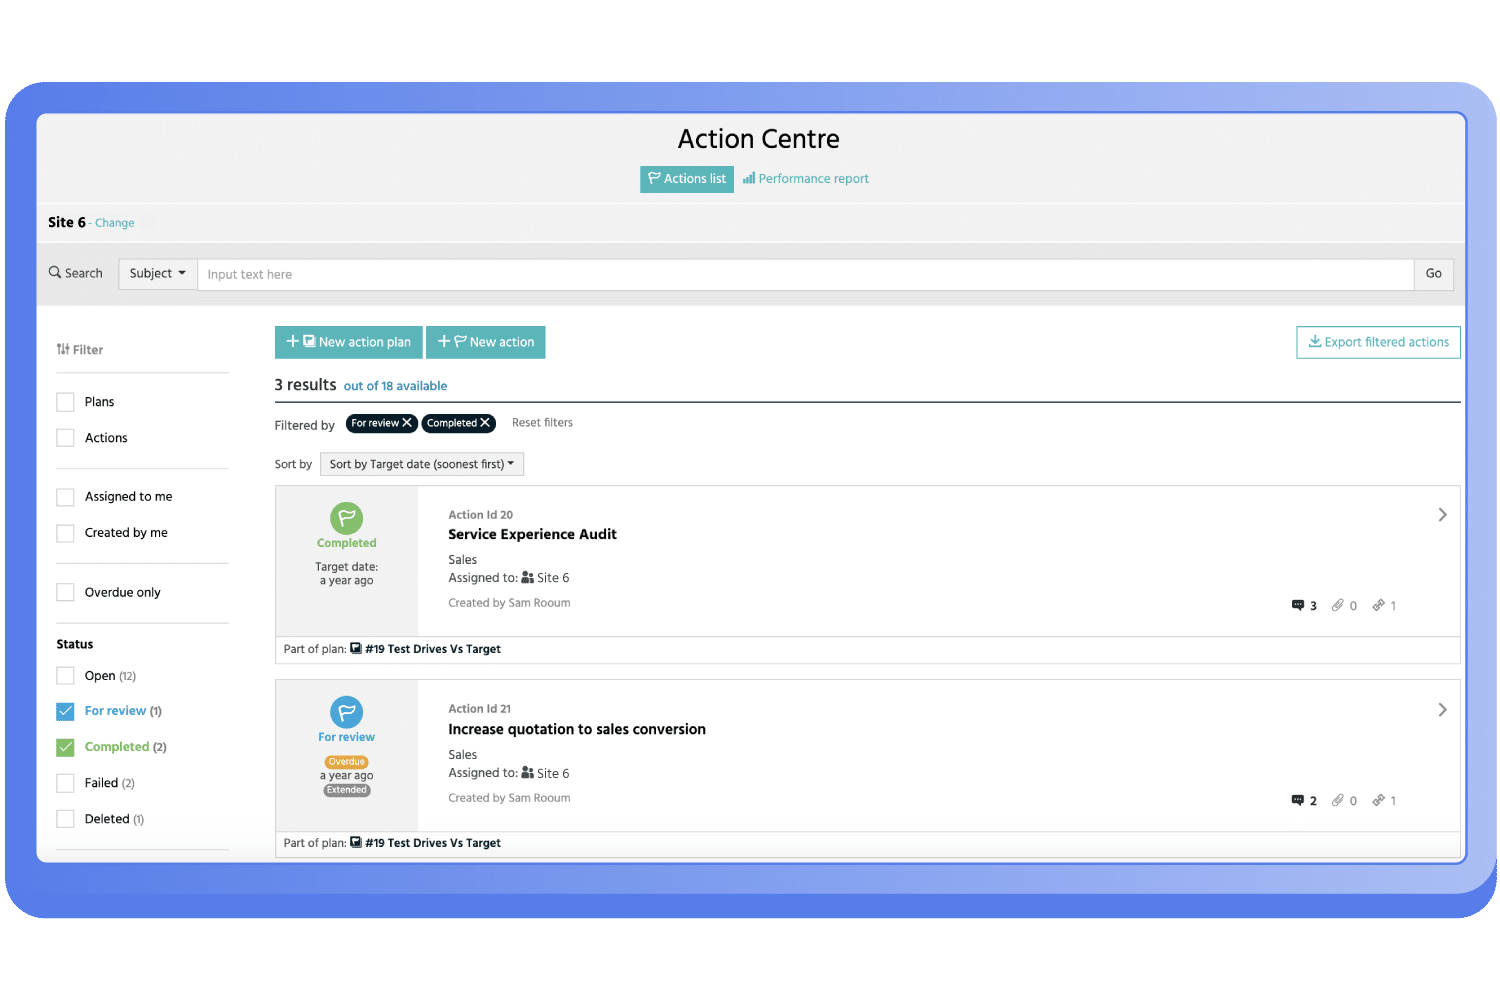
The Action Centre is a unique feature to Loop. It allows you to create actions against KPIs, assign them to team members, and track their progress. This feature comes with a central repository of all actions that provides visibility of progress and drives accountability. The outcome is an unparalleled ability to assign actions based on insights, and then follow through to ensure positive results.

3. Surveys
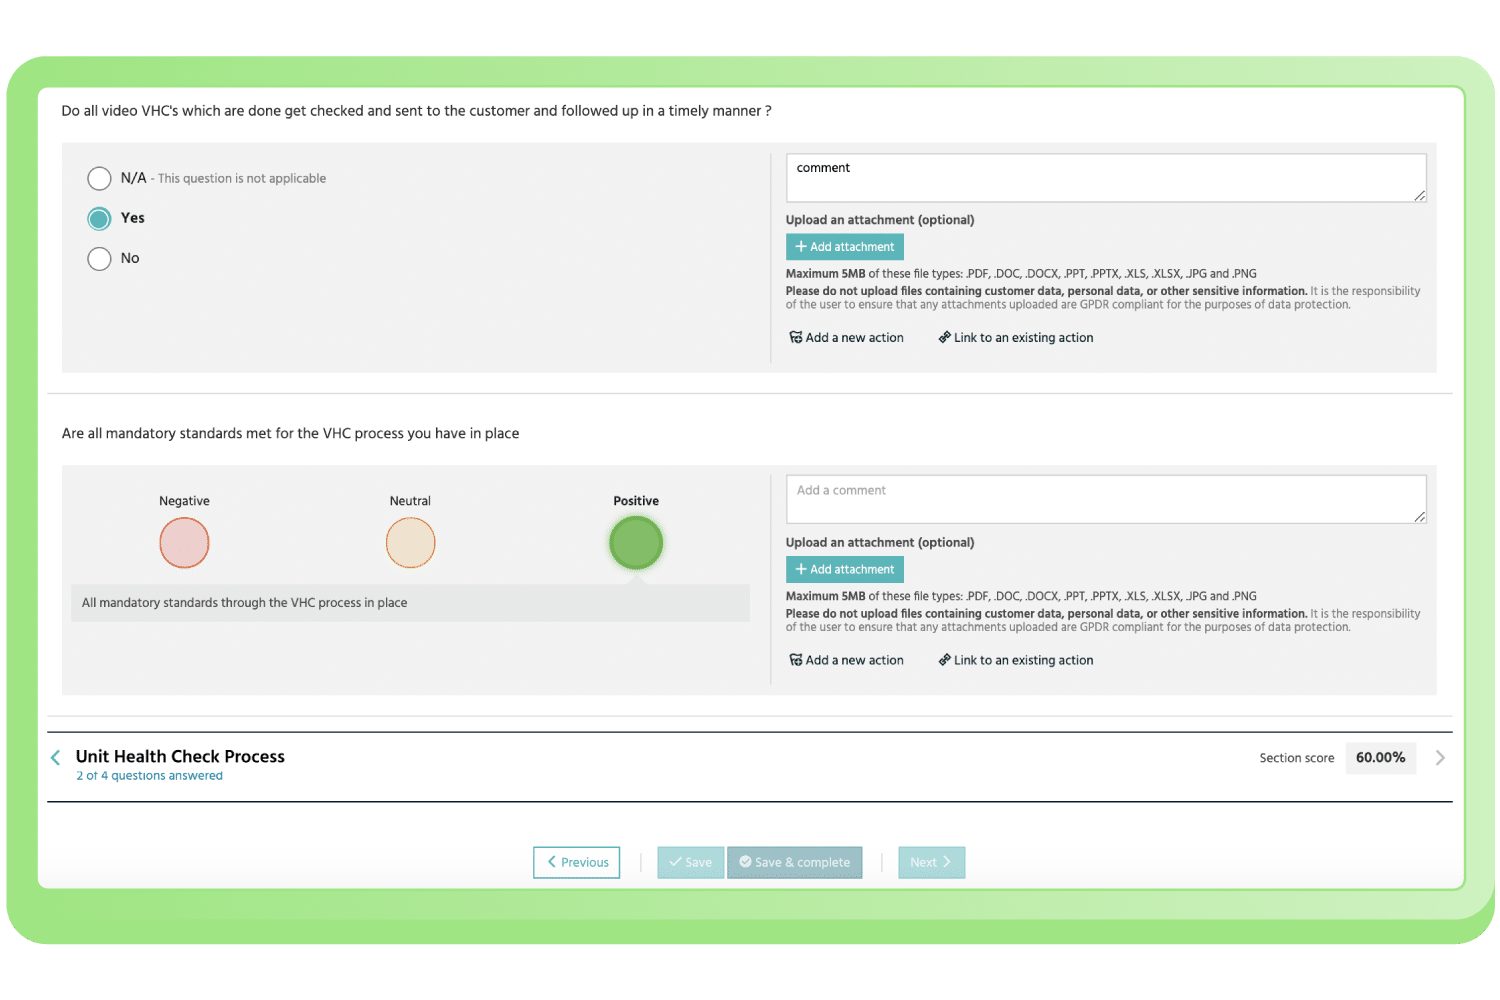
Data needs to be contextualised with “on-the-ground” information. You need direct feedback from staff and stakeholders about how things can be improved, and how transformation projects are evolving. To help with audits, quality control and feedback, we’ve embedded a survey feature in Loop that enables you to distribute standardised survey templates or build custom surveys, and use this to gather more information in order to inform planning and review results. This makes it easier to create an iterative process of data analysis and planning, all targeted at delivering effective results for your business.

Fundamentally, Loop is designed to help decision-makers go beyond data analysis to derive relevant insights and take actions. It also simplifies communication around these actions so that everyone across your franchise network works together towards positive outcomes.
Problem 3: Using too many tools and getting started on the wrong foot
For all the benefits you can reap from business intelligence, it’s challenging to get started with it. You need to upload data, change processes, ensure the capture and accessibility of data and train your staff. All of this is overwhelming and mistakes can be made along the way.
Choosing the right BI software is also trickier than it seems. Many tools are just good at one thing – some are mainly used for operational reporting, while others excel at importing and syncing data from different data sources. So businesses can easily end up using multiple BI tools at the same time, which incurs a large cost, requires a lot of training, and makes their management harder. This also makes the whole BI system less effective and siloed, as the data store in one tool is unlikely to be shared with another.
How Loop creates a solution
We built Loop as an all-encompassing platform for all your BI and business performance needs. We also have a range of managed services able to help you get started. That means we can integrate Loop into your existing workflows, customise the platform to meet your specific needs, and digitise your data quickly and effectively. Fundamentally, we can help you deliver the outcomes you need, and are flexible enough to accommodate that goal, whatever it may be. Loop comes with:
- Pro-active data integration: We take on the headache of gathering, cleaning, and integrating the data for our customers. We take messy, disparate data and turn it into clear, simple, and concise dashboards.
- Product flexibility: Loop offers the value for money and fast deployment benefits of an off-the-shelf product, but with the flexibility to accommodate bespoke customer requirements needed to make it your own.
- A one-stop-shop: Loop brings together all of the performance and data management tools our customers need to manage their business network remotely, with the tools working together to drive better results than separately.
- Customer service: Our entire team is focused on service — we are collaborative, transparent, reliable, flexible, and have a passion to deliver.
Fundamentally, we have a service component to what we deliver, can create bespoke offerings, help users get started, and provide a single tool that delivers all of your business intelligence requirements.
An all-encompassing tool that connects data with outcomes
Businesses that try to implement business intelligence often have to deal with complex reporting, data analytics that doesn’t guide towards actions and outcomes, and using different tools that focus on different aspects of BI. An effective business intelligence data strategy requires a different solution.
Loop solves all of these business intelligence problems by providing a single platform that makes BI intuitive and bridges the gap between data and outcomes via multiple features, with action planning being the most unique and action-oriented.
The complexity of today’s world requires a better approach to business intelligence. Only then you can achieve more organisational flexibility, a better understanding of your market and customers, and a more successful future for your business overall. That’s why you need to get started on the right foot with the right tool. Try a free demo of Loop today and see how it works.


