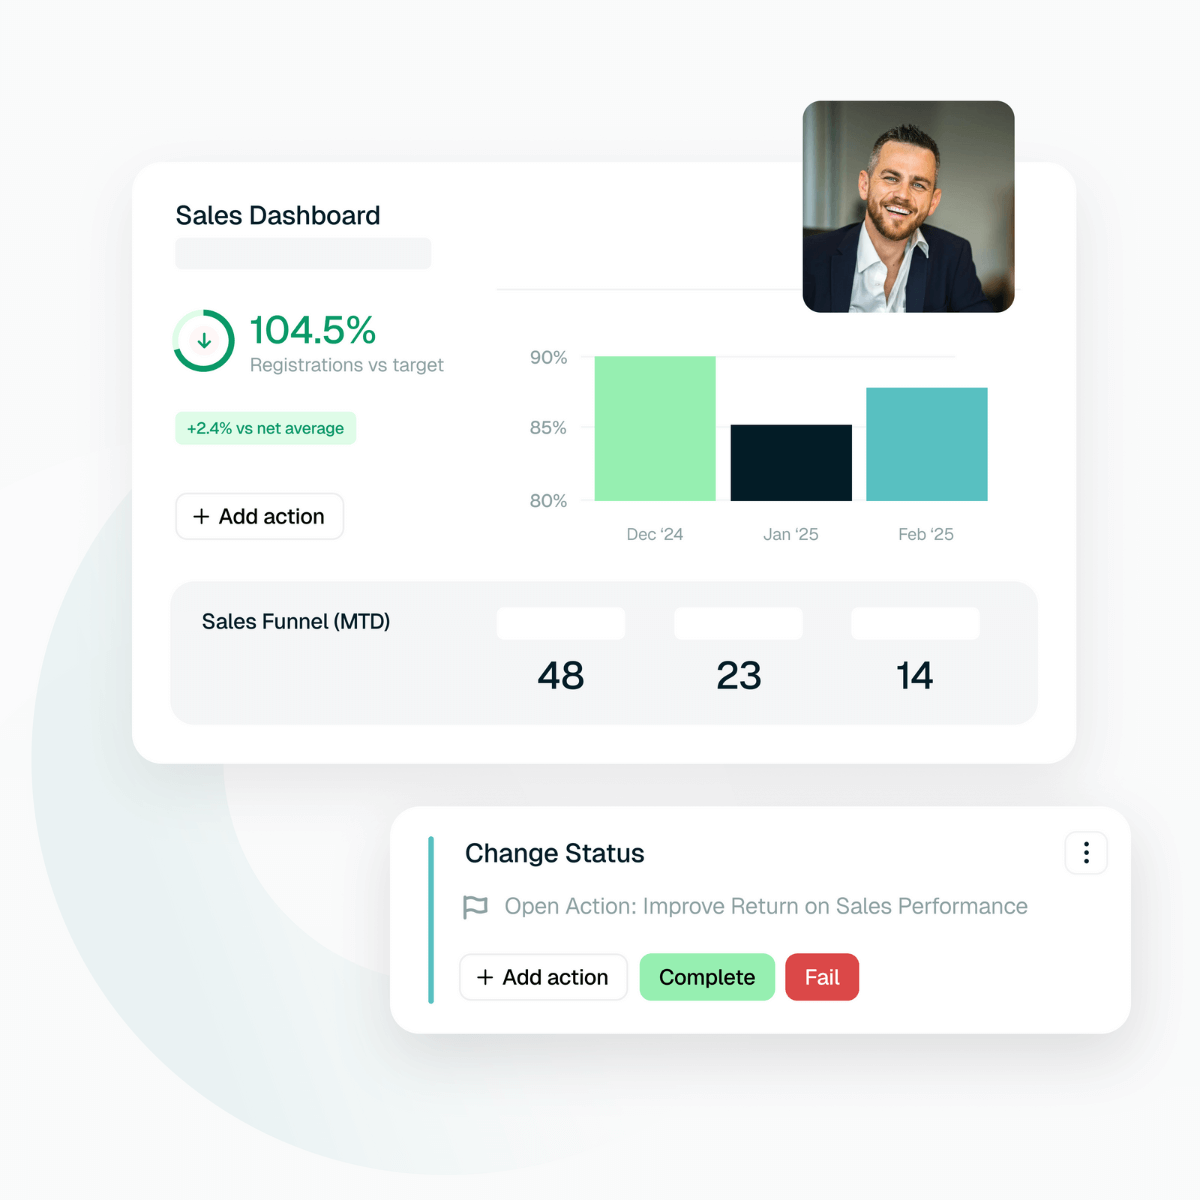
KPI Dashboards, Reports & AI Actions
Turn network insights into smart actions. Loop combines dashboards, reporting and action planning in one place. Pull in data from across your network, visualise KPIs and assign tasks to the right teams.

KPI Dashboards & Reports
Loop gives you a live view of business performance by pulling in data from multiple systems, so you can filter by region or timeframe and get the insights you need to take action.
- Track what matters: Focus on the KPIs that matter most to your business, from sales funnels to EV readiness
- See trends over time: Compare data month-on-month or year-on-year to spot shifts in performance or behaviour
- Zoom in by region or retailer: Drill down to specific areas, markets or dealers to see exactly where improvements are needed
KPI Tracking Across All Sources
Bring together data from your existing systems to calculate and display your key KPIs
Custom Dashboards With Built-In Actions
Dashboards designed around your industry needs, with the ability to assign actions straight from the data
AI-Powered Recommendations
Highlight high-impact actions based on trends, so you can use proven best practices to improve performance
Reporting By Audience
Generate performance reports - filtered by role, region or topic, ready for field teams and leadership
Action Planning & AI Suggestions
Loop helps you go from insight to action in seconds. Create tasks directly from dashboards or reports, track progress and use AI to focus where it matters most.
- Create actions from any page: Add next steps based on insights from dashboards, scorecards, surveys or dealer
- Track what’s happening: Monitor open, overdue or completed actions by region, role or retailer.
- Use AI to prioritise: Get suggestions based on trends and what’s worked before in similar situations
Get Clearer, Smarter Insights Across Your Network
See how Loop helps brands track KPIs, surface high-impact actions, and drive continuous improvement across every dealer

