<img height="1" width="1" style="display:none;" alt="" src="https://px.ads.linkedin.com/collect/?pid=3042745&amp;fmt=gif">
Skip to content
DRIVE dealer PERFORMANCE
 

See What's Driving Performance. Then Improve It.

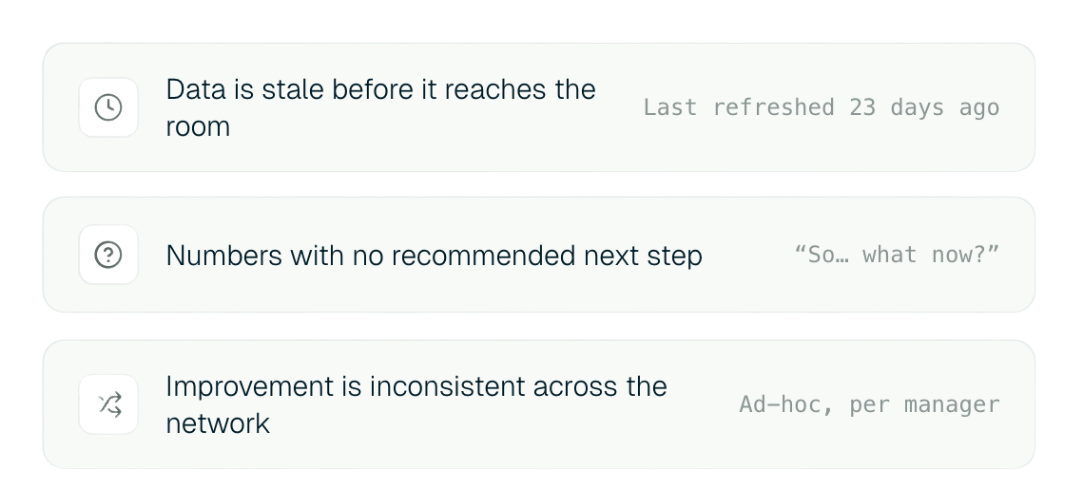
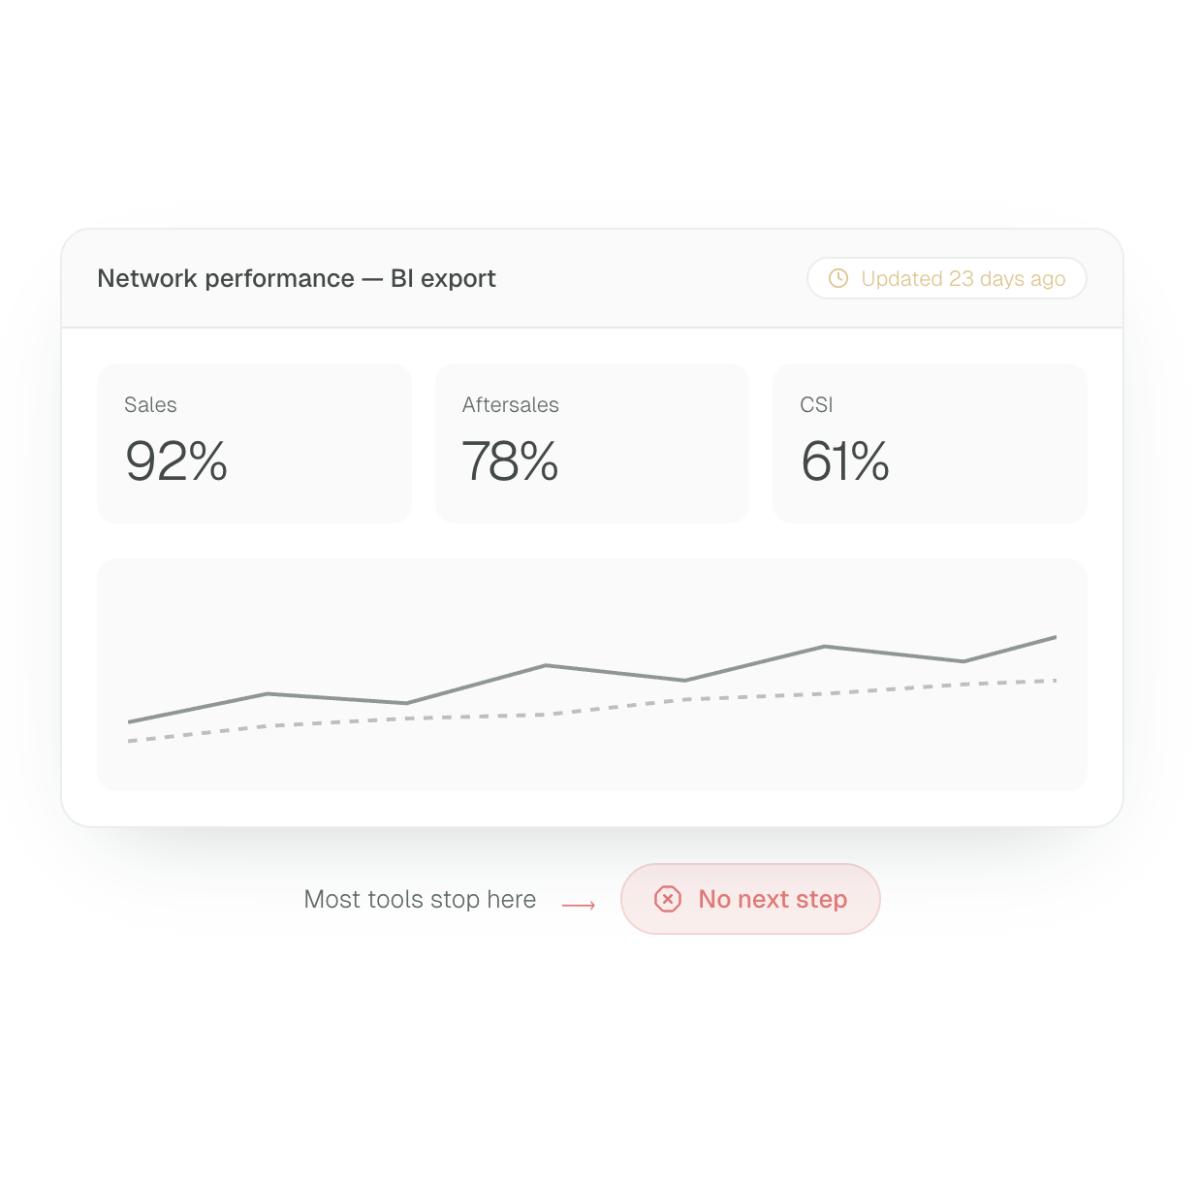
The challenge isn't finding data. It's knowing where to focus and what to do next. Loop helps OEM teams connect performance data to dealer visits, action plans and improvement programmes.

You said: "We're tracking performance in so many places, it's difficult to know where to focus first."

scorecard-action
INTERACTIVE DEMO

How To Drive Performance With Loop

Try an interactive walkthrough and see how OEM teams turn performance data into action with KPI tracking, scorecards, action plans and bonus programs.
The challenge

A Dashboard Tells You the Number. It Doesn't Tell You What to Do.

By the time performance data has been pulled from different sources, sense-checked and shared, it's already out of date. Dashboards and spreadsheets show the numbers. But not which dealers need attention, what to prioritise, or what action will have the biggest impact.

perform-before-issues
bi-dashboard
What good looks like

Performance Data That OEM Teams Can See and Act on

WHY LOOP IS DIFFERENT

We Don't Stop at the Dashboard.
We Close the Loop.

Seeing the number is the easy part. Real improvement comes from what happens next. Which is why actions come built in and are tied to the scores they're going to move.
loop-perform-measure-act-improve
How Loop helps

One View of Performance. With the Next Step Built in.

Loop Perform brings the KPIs that matter from Sales, Aftersales, CSI, into one consistent, real-time view. Area Managers see which dealers need attention before they visit. Directors compare regions without building a report. Every score that's off target gets an action attached.

loop-perform-dashboard
The modules behind it

Close The Loop Between Scores And Improvement

Actions come as default in Loop Perform. That's because we believe that's where the real behaviour change happens. Every score that's off target can carry an action, tied to the KPI it's meant to move. KPI's in Loop that have an action attached improve 3x faster.

Balanced Scorecards

Sales, Aftersales and CSI weighted into one fair, consistent score per dealer, comparable across the whole network.

✓ Weighted KPI scoring
✓ Benchmark & rank
✓  Drill to dealer level

Bonus Programs

Design transparent incentives dealers understand and trust, so the network is motivated to chase the right outcomes.

✓ Rule-based payouts
✓ Live progress to dealers
✓  Tied to scorecard KPIs

KPI Dashboards

Real-time dashboards. See where the network is heading, not just where it has been.

✓ You choose the KPIs
✓ Region & market roll-ups
✓ Sales funnel & forecasting views

"Loop has given us a 10% improvement in performance across Volkswagen Group UK. From head office through to field teams, users comment on the simplicity of Loop and how easy and clear it is to find what they are looking for."

A logo for the Volkswagen Group
Matt Bishop, Former Network Insights Manager, Volkswagen Group UK
How Loop helps

One View of Performance. With the Next Step Built in.

See your KPI data that matters in one consistent, real-time view. Area Managers see where a dealer needs to focus before they visit, so come prepared. Directors compare regions or areas without building a report. Every score that's off target gets an action attached.

Network Directors

You need a consistent, up-to-date view of the whole network and confidence that KPI performance is being acted on, not just reported.

✓ Region comparison
✓ Trend & forecast
✓ Action oversight

Area Sales Managers

You own the dealer relationships on the ground. You need to know who needs attention before you visit, with evidence in hand.

✓ Pre-visit prep
✓ See progress via set actions
✓ Dealers see their own actions

Dealers

Dealers can see performance data, targets and actions relevant to them, making it easier to understand priorities.

✓ Visibility of scores and targets
✓ Clear actions and next steps
✓ Track progress over time

Ready to see it


The Missing Link Between Data & Behaviour Change

A 30-minute walkthrough tailored to your priorities. See how OEM teams connect performance data to dealer visits, action plans and improvement programs across the network.

perform-demo-cta